Global equities ended a strong year on a weaker note as equity and bond markets both reacted negatively to guidance from the Federal Reserve (FED) that US interest rates will be cut by less than previously expected. The FED’s dot plot now indicates that interest rates will be cut twice in 2025, down from the four cuts forecast when the plot was last updated in September. The yield on the 10-year US Treasury rose by almost 40 basis points in the month. Oil prices increased as OPEC+ announced that it would push back plans to start gradually reintroducing 2.2 million barrels a day of crude until April 2025 and would also extend to 18 months the period over which the increase would take place.

FTSE World Global Equity Index (in euro terms), last 12 months
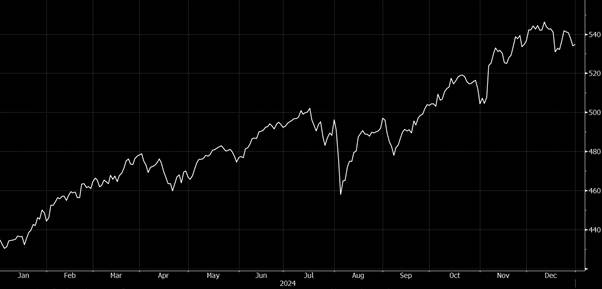
Source: Bloomberg
Equities Deliver Another Strong Year in 2024
2024 was another very strong year for equities. The benchmark MSCI World Index gained almost 17% in Euro terms, following an impressive 18% return in 2023. While gains were distributed across all sectors and regions, US large cap stocks outperformed. Several key factors have driven this impressive performance. Inflation eased significantly and most central banks implemented interest rate cuts, with further reductions anticipated in 2025. Economic growth has remained robust despite higher interest rates, while corporate earnings have also been resilient, surpassing market expectations. The election of Donald Trump as US president, alongside Republican majorities in the Senate and the House of Representatives, also boosted investor sentiment in November.
Global (white), US (yellow) and Eurozone (blue) Equity Markets and Magnificent 7 (green) – Last 12 Months
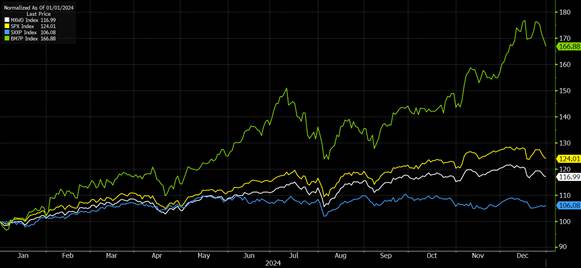
Source: Bloomberg
In the US, all individual sectors reported gains in 2024, with the highest increases seen in technology-related shares. Advancements in artificial intelligence have provided a tailwind for equity returns, most notably for the so-called Magnificent 7 tech stocks. These stocks have risen by over 66% in 2024, significantly outperforming the 24% gain of the broader S&P 500 index. Nvidia has been the best performer in this group, with the company’s share price increasing by over 170% this year, driven by high demand for its GPUs for AI related work. Tesla has also performed particularly well, rising by over 60%. The company unveiled its long-awaited Robotaxi, the Cybercab, during the year, while the appointment of CEO Elon Musk to the new Department of Government Efficiency also provided a boost to the share price.
S&P 500 Sector Performances – 2024
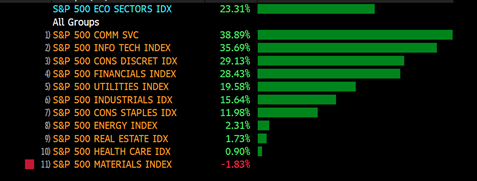
Source: Bloomberg
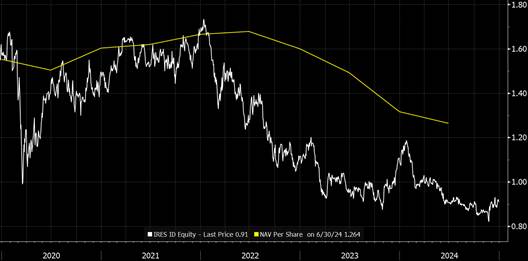
Mixed Performance in the Real Estate Sector
Listed Real Estate (REITs) experienced a mixed year in 2024, with performance varying significantly across regions and sectors. Institutional investors continue to assess real estate assets based on rental yields relative to returns from lower-risk investments like bonds and cash. With global interest rates having peaked, the pressure on real estate values began to ease, and optimism returned to certain market segments. As in previous years, the physical property market showed a lagged response, with reduced transaction volumes reflecting the ongoing adjustment to the new interest rate environment.
European and US Residential REIT Performance- 5 Years
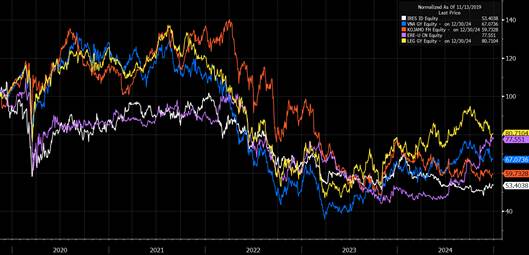
Source: Bloomberg
The outlook for the physical property market in 2025 is more positive, as stabilising interest rates are expected to support valuations. Sector performances were mixed in 2024, with logistics and industrial assets demonstrating relative resilience due to steady demand for e-commerce and supply chain infrastructure. In contrast, the Office and Retail sectors continued to struggle, facing reduced demand from traditional tenants and high vacancy rates, particularly in secondary locations. Oversupply in certain regions, combined with subdued tenant demand, contributed to further downward pressure on values. However, with yields likely having peaked, valuations across the board are expected to stabilise and gradually recover in the coming year.
IRES Share Performance – Last 5 Years
Source: Bloomberg
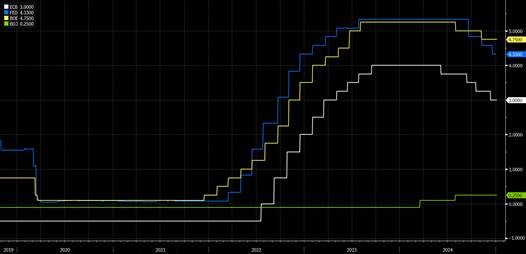
Global Policy Easing Continues as Inflation Eases
While the major central banks have been cutting interest rates as inflation fell through 2024, the market’s expectations for where rates will end up have been volatile. The year began with expectations of up to six rate cuts by the three major central banks (the Fed, BoE, and ECB), but as the year progressed, these forecasts were pulled back. Ultimately, the Federal Reserve implemented three rate, the ECB implemented 4 while the Bank of England cut rates twice. This shift in interest rate expectations has been a key driver of volatility in bond and equity markets.
Major Central Banks and Key Policy Rates
Source: Bloomberg
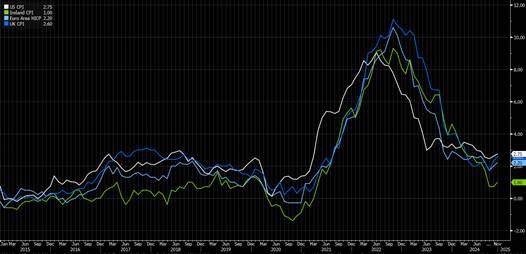
Significant progress has been made over the past twenty-four months in both the United States and Europe in combatting inflation, but in general inflationary pressures remain somewhat elevated.
10-Year CPI – US (White), Ireland (Green), Eurozone (Light Blue), UK (Dark Blue)
Source: Bloomberg
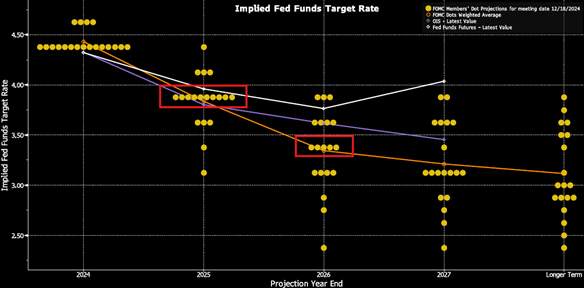
The Federal Reserve cut interest rates by 25 basis points in December, in line with market expectations. However, following the publication of the Fed’s “Dot-Plot” which projects the US Central Bank’s best estimate of future rates, the US stock and bond markets fell sharply. The Fed revised its 2025 outlook from 3 interest rate cuts to 2, a total of 50 basis points, with a similar projection for 2026. Meanwhile, the Fed raised its PCE inflation expectation from 2.1% to 2.5% by the end of 2025. Acknowledging that inflation remains a concern, the Fed now expects inflation to be 2.1% at the end of 2026, still slightly above its 2.0% target.
FOMC participants’ assessment of appropriate monetary policy
Source: Bloomberg
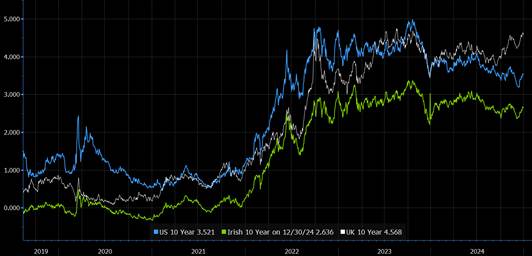
Government Bond Yields in 2024: A Year of Volatility and Shifting Rate Cut Expectations
Government bond prices remained volatile throughout 2024 due to shifting expectations for interest rate cuts. The yield on the 10-year US Treasury began the year just under 4%, rose as high as 4.7% in April, before falling back to 3.6% in September, and ended the year at 4.5%. This volatility has largely been driven by significant changes in expectations for interest rate cuts in the US. The Fed’s latest “dot plot,” a gauge of policymakers’ outlook released in December, now suggests the central bank will cut interest rates twice in 2025, compared to the four quarter-point cuts previously expected in September.
US (Blue), Ireland (Green), and UK (White) Government Bond Yields – 5-Year Chart
Source: Bloomberg
In Europe, bond yields have followed a similar trend, despite the ECB striking a more dovish tone, vowing more rate cuts as inflation continues to ease and the Eurozone economy underperforms. The 10-year bond yields for German and Ireland both rose by 30 basis points (bps) in 2024, while in France, this figure was as high as 50 bps following political instability in the country. In the UK, the 10-year GILT yield rose 1% in the past 12 months, despite two rate cuts, following the controversial budget in October which entailed a significant scale up in borrowing. In Japan, yield rose by 40 bps as the Bank of Japan ended its negative interest rate policy which had been in place since 2016
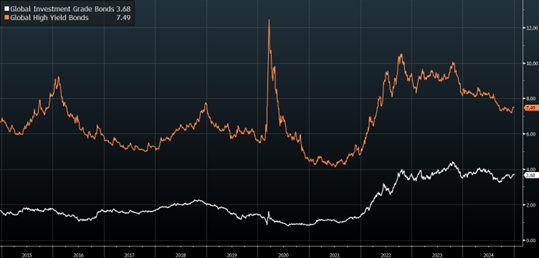
Corporate Bonds Benefit from Falling Yields and Tightening Spreads
The global corporate bond market delivered a strong performance in 2024, driven by declining yields and narrowing credit spreads. These trends were primarily influenced by easing inflation, dovish shifts from major central banks, and improving corporate fundamentals. Yield spreads narrowed significantly across both investment-grade and high-yield segments, reflecting growing investor confidence in corporate credit quality. Investment-grade bonds outperformed high-yield debt globally, as investors leaned toward safer assets.
Global Corporate Bond Yields – Investment Grade (White) and High Yield (Orange)
Source: Bloomberg
2024 Currency Markets Overview
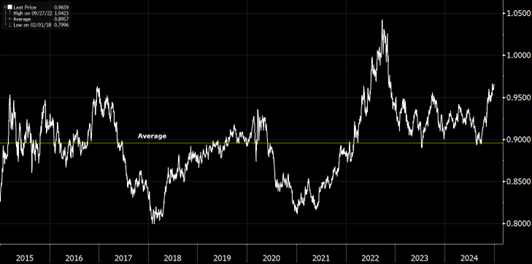
The US Dollar appreciated markedly in 2024, reaching a two-year high by December. This was largely due to the Federal Reserve’s more hawkish stance, with policy rates maintained at or above 4% and limited rate cuts signaled for the year ahead. The Dollar Index (DXY) rose by approximately 7% over the year. The Euro depreciated against most currencies in 2024 impacted by ongoing economic challenges and political uncertainty in France and Germany. By year-end, the US Dollar had gained 6.15%, reflecting the broader strength of the dollar.
USD/EUR Performance Over the Last 10 Years
Source: Bloomberg
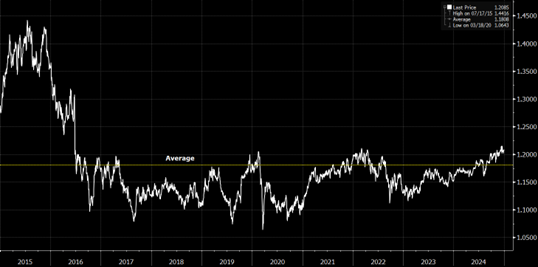
The British Pound, on the other hand, rallied to a new high for 2024 against the Euro, reaching 1.2100. This movement in GBP/EUR was driven by EUR weakness, as the ECB continued its rate-cutting cycle. The British Pound strengthened against both the dollar and the euro, buoyed by expectations that the Bank of England would refrain from cutting rates in the near term, with only modest reductions anticipated for next year.
GBP/EUR Performance Over the Last 10 Years
Source: Bloomberg
Strong Global GDP Growth Outlook
In December, the Organization for Economic Co-operation and Development (OECD) raised its global growth forecast for 2025 and 2026 to 3.3%, which is above the expected growth rate of 3.2% for 2024. Growth expectations vary significantly across different regions. GDP growth in the United States is projected to be 2.8% in 2025, before slowing to 2.4% in 2026. This is slightly below the most recent GDP readings for the world’s largest economy. Economic expansion of 3.1% was recorded in Q3, following 3.0% growth in the second quarter. Full-year growth for 2024 is forecast to be 2.7%. In the euro area, the recovery in real household incomes, tight labour markets, and easing monetary conditions continue to drive growth.
Euro area GDP growth is forecast to be 1.3% in 2025 and 1.5% in 2026. Growth in Japan is projected to expand by 1.5% in 2025 but then decline to 0.6% in 2026. China is expected to continue to slow, with GDP growth of 4.7% in 2025 and 4.4% in 2026. However, the OECD has warned that protectionist trade measures pose a major risk to the global economy, a reference to Donald Trump’s upcoming inauguration. Increases in trade-restrictive measures could raise prices, deter investment, weaken innovation, and ultimately lower growth, the OECD warned.
Global Economic Data Heatmap
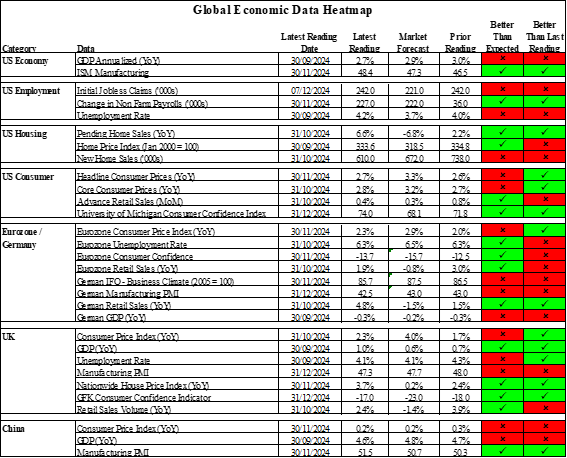
Source: Bloomberg
Agri Commodities: Modest Gains Amid Supply Constraints
Soft commodities recorded modest gains amid supply-side constraints and volatile weather patterns, including prolonged droughts in key producing regions. Coffee prices, in particular, were buoyed by crop shortfalls in Brazil, while wheat and corn saw price spikes following disruptions in Black Sea exports. Demand for agricultural commodities remained stable, with emerging markets driving consumption growth despite elevated costs.
Agri Commodities Price Performance: 1-Year Chart
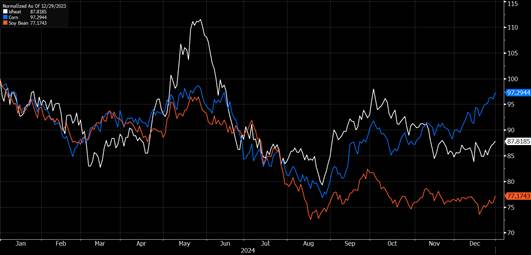
Source: Bloomberg
Energy commodities
Energy commodities experienced heightened volatility, reflecting shifts in global demand and supply dynamics. Crude oil prices hovered around $75 per barrel, supported by OPEC+ production cuts and a rebound in global travel, though gains were tempered by slowing economic activity in China and parts of Europe. Natural gas prices faced downward pressure, particularly in Europe, due to an unseasonably mild winter and higher storage levels.
Crude Oil and Natural Gas Price Performance: 1-Year Chart
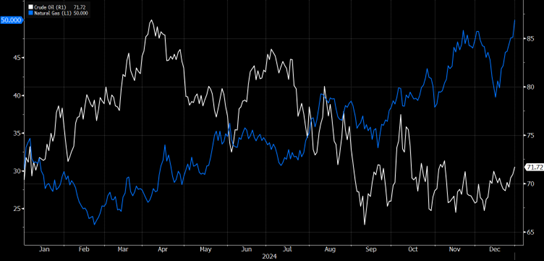
Source: Bloomberg
Metal & Mining Commodities
Industrial metals including copper and aluminum faced headwinds from weaker-than-expected Chinese demand, though infrastructure investment in the U.S. and Europe provided some support. The SPDR S&P 500 Metals and Mining ETF experienced significant volatility during the year, finishing down 4.60%.
Metals Price Performance – last 12 Months
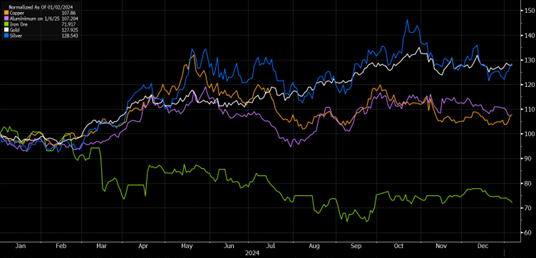
Source: Bloomberg
Gold Gains Amid Geopolitical Tensions
Precious metals such as gold and silver saw robust gains in 2024, with gold rising by 27% as investors sought safe-haven assets amid persistent geopolitical tensions and fluctuating interest rate policies. Silver also gained momentum, supported by its dual role as a safe-haven asset and a critical input in renewable energy technologies.
Gold Price Performance – last 10 Years
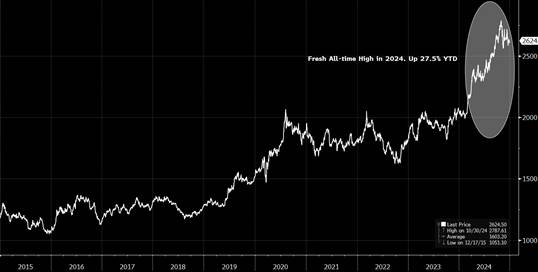
Source: Bloomberg
Wellesley Investments & Pensions Ltd.
09/01/2025
This Research Note has been prepared by Wellesley Investments & Pensions Ltd. on the basis of publicly available information, internally developed data and other sources believed to be reliable. While all reasonable care has been taken in the preparation of this document, we do not guarantee the accuracy or completeness of the information contained therein. Any opinion expressed (including estimates and forecasts) may be subject to change without notice.
The information presented in this Research Note is provided for information purposes only and is not to be used or considered as an offer or the solicitation of an offer to sell or to buy or to subscribe for securities. We or any of our connected or affiliated companies or their employees may have a position in any of the securities or may have provided, within the last twelve months, significant advice or investment services in relation to any of the securities or related investments referred to in this document. Nothing in this Research Note constitutes investment advice or a representation that any investment or strategy is suitable or appropriate to your individual circumstances, or otherwise constitutes a personal recommendation to you. The value of investments can fall as well as rise and there is no guarantee that investors will receive back their capital invested. Past performance and simulated performance is not a reliable guide to future performance. Projected returns are estimates only and are not a reliable guide to the future performance of an investment.
While reasonable care has been taken in the preparation of this Research Note, no warranty or representation, express or implied, is or will be provided by Wellesley Investments & Pensions Ltd. or any of its shareholders or affiliated entities, all of whom expressly disclaim any and all liability for the contents of, or omissions from, the research provided, the information or opinions on which it is based and/or whether it is a reasonable summary of the securities in the research.
All material presented in this publication is copyright to Wellesley Investments & Pensions Ltd. None of the material, nor its content, nor any copy of it, may be altered in any way, transmitted to, copied or distributed to any other party without the prior express written permission of Wellesley Investments & Pensions Ltd.
Wellesley Investments & Pensions Ltd. is regulated by the Central Bank of Ireland.